Tomato Split Sorting
By Jacob Marquez - Aug. 20, 2025 - PDF Version
Industrial agricultural operations face difficulty in logistics because of the natural virtue of crop variety. Aside from benign but ugly mutations a host of other issues are present that must be removed for aesthetics at best or food safety at worst. As most growers and suppliers operate as economies of scale, automation is a key ingredient to keeping costs consistently low.CropDetect demonstrates a drop-in AI sorting system focused on practicality. This paper demonstrates that while using a mock mechanical filtering system, the AI was trained to identify splits in tomatoes and achieved over 90% classification accuracy. This proves scalable sorting is possible with minimal upfront integration work.Methods & MAterials
Of twelve pounds of tomatoes about half were scored and left out to dry overnight. The splits were between ¾ and 1½ inches long and on random sides and angles. From these, 262 photos were taken, annotated with Tomato and Split classes, and used to train a YOLOv8 object detection model with transfer learning. The model was trained for 50 epochs and achieved a 0.761 mAP@0.5.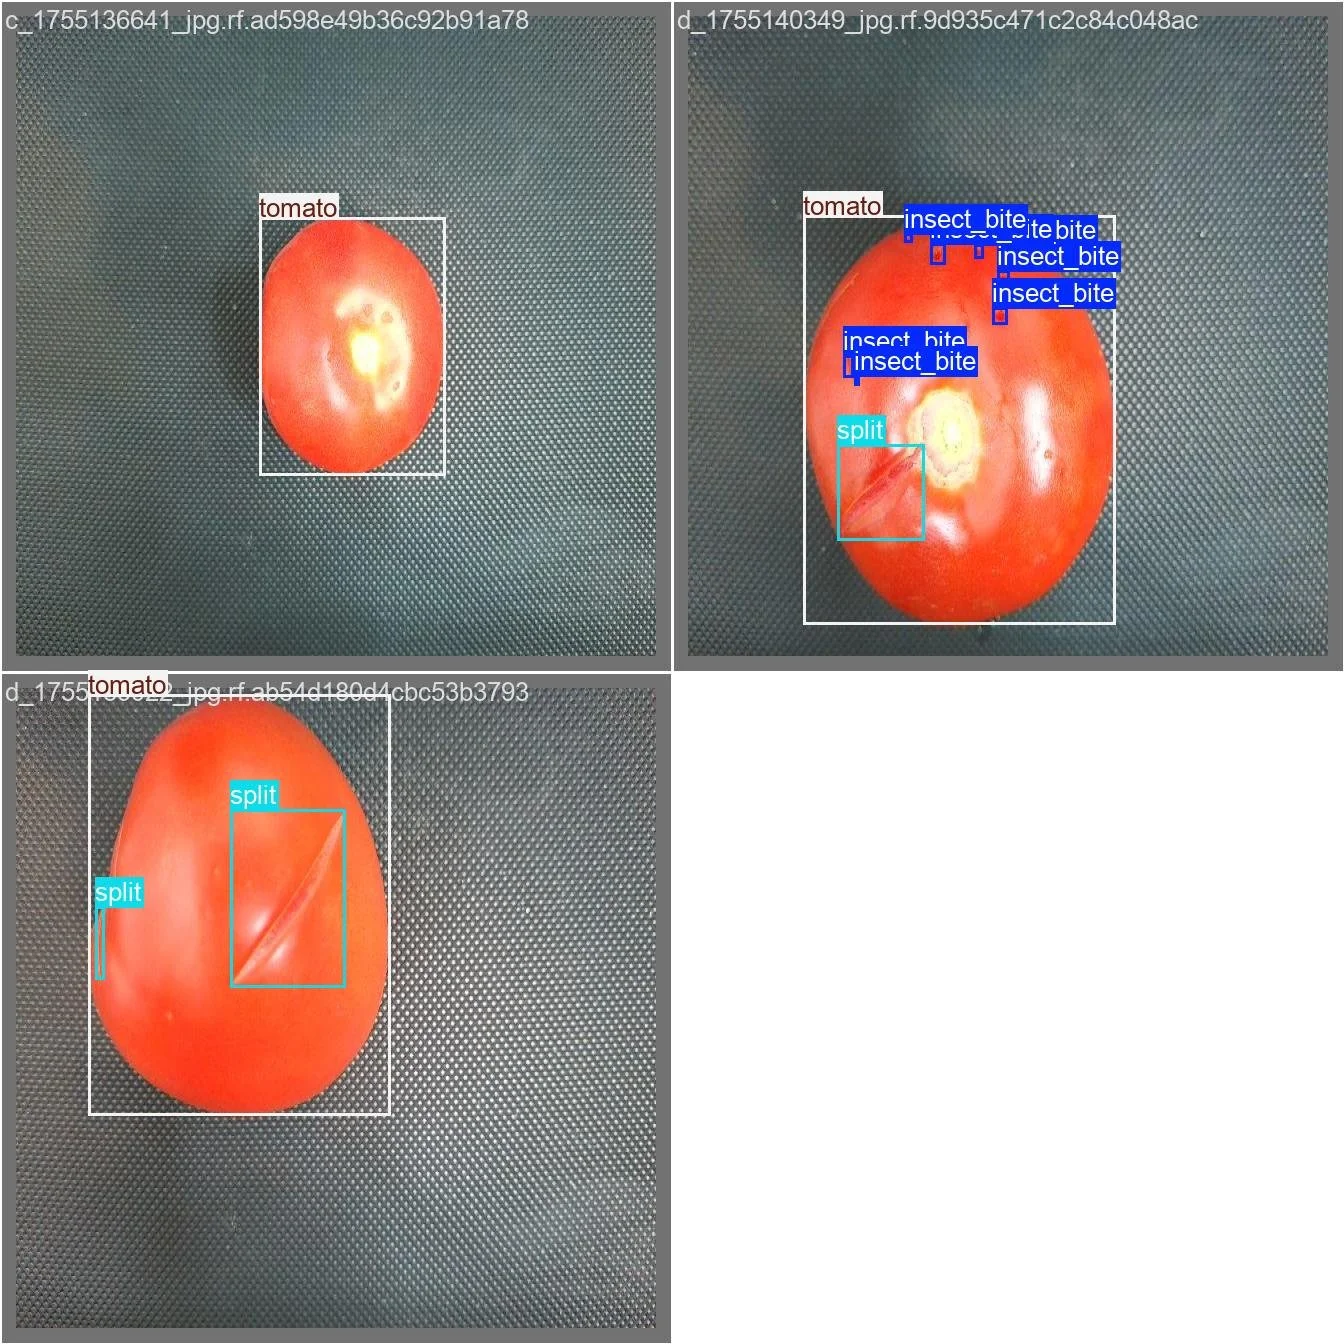
A 16”x36” belt moving 55 feet per minute was raised 16” off the ground, and two plastic bins were put underneath the end. Mounted 42” above the belt was an 18” 55W ring light with a diffuser for softening glare. A wooden stand sat on top of the belt with camera mounts at 24” and 16” for Phase 1 and 2 respectively. Lastly, a wooden stand with servos mounted to it was set 4” from the end of the belt. Tomatoes falling from the belt would naturally fall into the far plastic bin, but if the servo arm triggered and swung out its attached paddle, the tomato would collide into it and bounce into the closer plastic bin.
A 12MP Oak-1 fixed-focus camera with 4 TOPS processing power was used in Phase 1 and Phase 2, and a 13MP Oak-D Lite fixed-focus camera with 4 TOPS processing power was used in Phase 2 as well. Both cameras have onboard processing capabilities used to run the previously trained model and return tomato detections to the host machine. The cameras have large fields of view, 69° HFOV, 55° VFOV and 69° HFOV, 54° VFOV respectively, comfortably covering the entire belt at both mounting positions. An off-the-shelf SBC was used to connect to both cameras and run CropDetect, which processed the image input and spatial calculations and directed the servos when to activate.Before testing, the split tomatoes and control tomatoes were counted, and then mixed into random groups of 12 to 18. After each group of 12 to 18 went down the belt, the results were recorded and the bins were emptied to avoid overfilling. Between Phase 1 and Phase 2, four more pounds of tomatoes were purchased and processed to introduce more novel data the model had not seen before.Phase 1 results
The initial mounting configuration had the the OAK-1 camera 24” above the belt pointing straight down with these results:Expected 54 Good, 40 Defects
ACtual 83 Good, 11 Defects
Camera recordings during manual tests indicated that defects were being picked up by CropDetect, but during actual belt tests the tomatoes were at unfavorable angles, or rolling when in view. It’s clear the belt system needed to be fine-tuned to improve the abysmal %69.15 accuracy rating.Phase 2 Results
While theoretically if all tomatoes were spheres, any camera angle could view %50 of their surface, they are not, and you cannot. When placed on their base and viewed from above, their large tops obstruct the view of their sides. In Phase 2, an Oak-D Lite was introduced, and both cameras were moved to opposite edges of the belt, and pitched 35° inward toward the belt center. This way both cameras saw more of the tomato's profile and base than the previous vertical setup. Of course this required updated spatial calculations for the downstream servos to operate in time, which CropDetect obliged to make easy as a configuration update. The following results were a marked improvement:Expected 30 Good, 90 Defects
Actual 44 Good, 76 Defects
Certainly the processing power of an added camera has a general effect, but manual testing and visual inspection showed the alternate angles picked up detections missed before with the vertical mount. This led to a more respectable %88.33 accuracy. It should also be noted that there were no false positives, as in tomatoes that were removed from the “Good Bucket” incorrectly.The primary cause of missed defects in Phase 2 was splits that were close to the bottom of the tomatoes, where they were either completely hidden or obscured. In a fleshed out industrial sorter, it would be better to transport the tomatoes on a special belt that held them in place and rotated or flipped them to expose their entire surface area to the cameras. To simulate this, the experiment was repeated, where tomatoes with defects that were not initially sorted into the defect bucket were flipped over, and sent down the belt again.Expected 30 Good, 90 Defects
Actual 38 Good, 82 Defects
Here we can see that tomatoes not initially sorted were caught the second time when flipped to expose their other side. Altogether with previous changes we have achieved %93.33 accuracy with zero false positives.Conclusion
The changes made in the result phases were concerned with camera placement and the mock mechanical filter system. Along the way CropDetect was flexible to adapt to each situation, exemplifying itself as a drop-in solution. This points to its extensibility for other crops and preparation for pilot deployment for growers and suppliers in the Pacific Northwest.Biases
Accuracy is a function of configuring the model's confidence threshold. Lowering the confidence rating means the model will emit more predictions, possibly capturing more defects, but increasing the chance of false positives. In this experiment we opted for a %50 confidence threshold to optimize against false positives, but others might prefer to lower the rating and remove as many defects as possible at the expense of introducing false positives.The tomatoes themselves were not selected with any criteria, but were sourced from a single supermarket at a single point in time, most likely not representing the real amount of variation you would see in a crop. More and varied training data would be necessary in a production environment.While the plastic tomato bins had some packing paper for padding, the tomatoes were still falling 16” inches, potentially hitting a servo paddle, and landing on other tomatoes. While no new splits were added during testing, the existing ones expanded and swelled slightly, potentially making them easier to detect in later testing runs. Additional testing runs with fresh tomatoes should be done to confirm.